
River Walk, Riverbank, California
If you want to understand a project like River Walk, don’t start with the slogan or the rendering. Start with the edge.
On paper, edges look clean: a red outline, a dashed line, a hatch pattern. In real life, edges are messy things—orchards taper into levees, canals cut diagonals through fields, property lines zig where history and water once argued. That’s why “project footprint” matters. It’s not just where a development lands; it’s what the development touches—hydrology, habitat, agriculture, public access, and the future shape of a city’s growth.
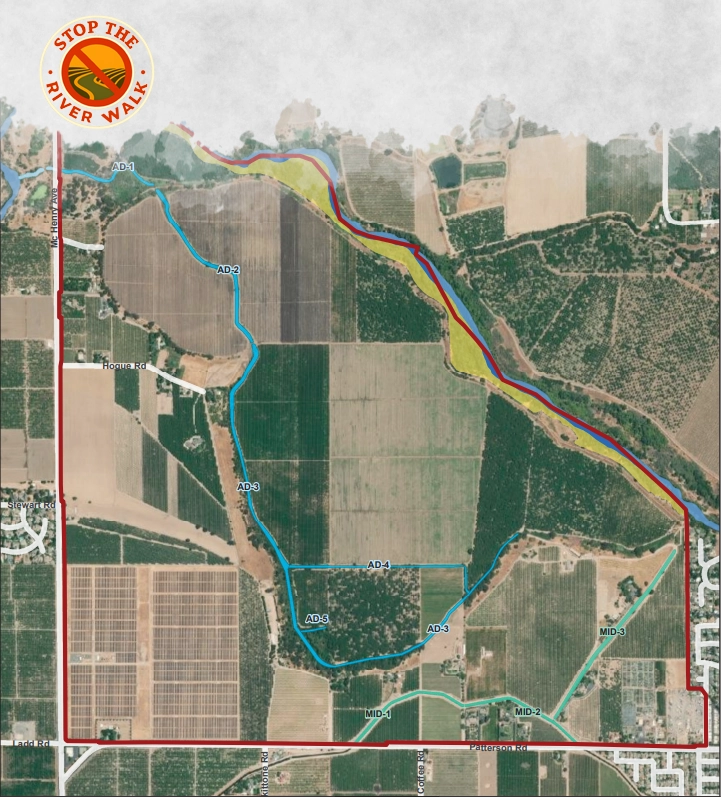
River Walk is being presented as a mixed-use community planned along the Stanislaus River, west of Riverbank—north of Patterson Road/SR 108 and east of McHenry Avenue, about two miles northwest of downtown. But the more you read, the clearer it becomes that River Walk isn’t one footprint. It’s multiple footprints layered on top of one another—each with different legal meanings and different consequences.
This installment maps what’s proposed using the public materials available so far—and then names the places where the map still fades into fog.
The first map: where River Walk is located

The simplest description of River Walk’s geography is also the one repeated most often: land just west of the city, along the Stanislaus River, bounded generally by McHenry Avenue to the west and Patterson Road/SR 108 to the south, with the river defining the northern edge. That description matters because it positions River Walk at a familiar California threshold: the seam where a town meets farmland, and farmland meets a river corridor.
The River Walk materials also emphasize a jurisdictional reality: the Specific Plan area is in unincorporated Stanislaus County and currently outside Riverbank’s city limits and Sphere of Influence (SOI). That means River Walk isn’t only a development proposal—it’s also a boundary proposal, with annexation and SOI expansion baked into the project’s DNA.
The three footprints you have to keep separate
1) The SOI Expansion / “Overall Project Area”
Public notices and presentations describe an SOI expansion covering roughly 1,522 acres. This is the biggest outline—the “outer envelope.” It’s the land that would be pulled into Riverbank’s sphere even if not all of it is immediately developed.
2) The Specific Plan Area (and primary annexation area)
Within that larger 1,522-acre envelope is the River Walk Specific Plan Area, described in more recent City materials as roughly 997 acres. The Draft EIR Notice of Availability likewise frames the Specific Plan as covering about 997 acres of the SOI expansion area.
In the City’s 2025 presentation, annexation is described as approximately 997 acres (Specific Plan Area), plus an additional 4.38 acres (four parcels) at the southeast portion of the broader project area.
3) The “Berghill Boundary” (applicant-controlled area)
A third outline appears in presentations: the Berghill Boundary, described as the area within the Specific Plan that is controlled by the project applicant. In earlier materials this boundary is described as 772 acres (GIS).
Why this matters: a Specific Plan can describe a coherent vision across the plan area, but land control affects phasing, timing, and what becomes “real” first. When residents ask, “Which parts are actually going to happen?” they’re often asking, knowingly or not, “Which parts are inside the applicant’s boundary?”
What’s there now: farmland, scattered uses, and water infrastructure
A project’s footprint isn’t just acres; it’s what those acres are currently doing.

In the NOP-era project description, the Project Area is described as largely agricultural and designated primarily as Agriculture (AG) under the Stanislaus County General Plan, with a small portion identified as Urban Transition. County zoning is described as predominantly General Agriculture (A-2), with references to 40-acre and 10-acre agricultural districts.
The CEQA documentation and summaries also describe the on-the-ground uses in more concrete terms: orchards (almond, walnut, cherry), fallow land, scattered tree stands, and dispersed rural home sites; plus other uses such as a commercial nursery, truck storage, a solar farm, and the Modesto Rifle Club.
Water infrastructure is not a side note here—it’s one of the defining “lines” on the map. The site includes waterways like the Stanislaus River and a Modesto Irrigation District (MID) canal, along with easements that cross portions of the area. These are the kinds of features that turn a simple boundary into a complicated footprint: they shape where roads can go, where trails can connect, what can be graded, and where environmental review becomes most sensitive.
What’s proposed: the land-use map as a promise (and a set of numbers)
The Draft EIR Notice of Availability describes River Walk as a mixed-use development project with a range of residential densities, neighborhood-scale retail and services (including health/medical), a private clubhouse, public recreation, a pedestrian/bicycle trail system, and extensive open space and landscaping. It estimates 2,432–2,682 residential units and 375,000–875,000 square feet of mixed-use space, with a “large portion” intended as an age-restricted active adult community.
A 2025 City presentation provides a land-use summary for the Specific Plan Area totaling approximately 997 acres, along with ranges for units and commercial square footage. In that same presentation, River Walk is also described as a set of “villages” totaling 2,432 lots, with many of the villages identified as age-restricted.
Local coverage echoes this framing, describing 18 village groupings and emphasizing the large scale of the plan area.
So what does that land-use map actually do? It converts “place” into categories—Low Density Residential, Mixed Use, Park, Buffer/Greenway/Open Space—and assigns acreage to each. That’s the formal mechanism by which farmland becomes entitlements. has framed the project and what questions were raised.
Mapping the change: from “Agriculture (AG)” to “Residential + Mixed Use” (and a lot of “Reserve”)
Land-use change is easiest to see when you compare “before” and “after” categories.
Existing designations (how the area is framed today, in City planning terms)
A City presentation summarizes existing City land use designations across the broader project area, including a substantial acreage identified as Agricultural Resource Conservation Area, along with residential, mixed-use, open-space/greenway categories, and “Reserve.”

Proposed designations (how the area would be reframed)
The “after” picture is dominated by residential acreage (especially low density), mixed use, parks/open space categories, and—crucially—Reserve land in the wider 1,522-acre SOI expansion area.
Here’s where the footprint becomes a story about future land-use change, not just immediate development:
- The Specific Plan covers about 997 acres and is the area being positioned for annexation, pre-zoning, and development.
- The SOI expansion covers ~1,522 acres, meaning hundreds of acres would be inside Riverbank’s sphere but not currently proposed for development.
- The City’s 2025 presentation describes ~520 acres expected to remain outside city limits under a Reserve designation while still being included in the SOI.
That last point is the quiet hinge in the entire footprint conversation. It effectively creates a two-stage map:
a long-term influence map (SOI expansion with “Reserve” land) whose future is not yet fully defined.
a near-term annexation/development map (Specific Plan Area), and
The “Stop the River Walk” Document Hub (what it’s trying to solve)
One barrier for the public is that major projects scatter documents across agencies and platforms. Stop the River Walk’s Documents & Maps page positions itself as a one-stop reference and points readers to:
- LAFCO & county materials (SOI applications, staff reports, agendas/minutes), and
- city planning & environmental documents (Specific Plan, Draft EIR, technical studies).
Even if you disagree with the group’s conclusions, the structure is useful: it’s built around a civic principle that holds up under any viewpoint:
Read primary documents first. Argue from evidence second.
“BGOS,” the river edge, and what “open space” actually means

One of the most emotionally resonant promises attached to River Walk is river access—the idea that the development will “connect” people to the Stanislaus River through trails and preserved frontage.
The project’s promotional materials describe a nature trail along the river and claim preservation of 48 acres of riverfront property, including about a mile of frontage inside the levee. Meanwhile, public agency documents emphasize a pedestrian/bicycle trail system and extensive open space and landscaping as core components of the plan.
In the land-use tables, the river-adjacent open-space framing shows up under “B/G/OS” categories—Buffer/Greenway/Open Space—split into pieces like Bluff, Canal, and River Park.
But here’s the unanswered mapping question buried inside those reassuring green labels:
“Open space” is not a single thing.
A green area on a land-use plan can mean:
- a habitat corridor with strict protection,
- a landscaped buffer with ornamental trees,
- a multi-use trail with lighting,
- a stormwater facility that doubles as recreation,
- or a placeholder for future decisions.
The NOP materials even describe Multi-Use Recreation/Resource areas as potentially accommodating stormwater detention, groundwater recharge, and passive recreation—uses that look green but function as infrastructure.
So when the map says “BGOS – River Park,” the real question becomes:
What’s the management intent? Habitat? Amenity? Both? And what happens if those goals conflict?
Roads are land use, too: the “Rights-of-Way” footprint
A newsroom approach doesn’t start with “for” or “against.” It starts with Most people read land-use maps as housing vs. parks vs. shops. But roads are one of the most permanent forms of land conversion: once you pour a network, you’ve declared a future.
The River Walk documents explicitly anticipate major circulation components, including continued or new connections (like Coffee Road extending north through the project area, as described in local coverage). And the plan’s land-use summaries allocate significant acreage to rights-of-way.
This matters for land-use change because the “footprint” of development isn’t only the building pads—it’s the grid that makes those pads possible. Roads, utilities, and drainage systems are the irreversible geometry that turns an agricultural landscape into an urban one.
The “Reserve” lands: the biggest footprint question that isn’t a housing count
If you want a single, simple reason the River Walk footprint is hard to summarize: it’s because the project draws a 1,522-acre circle, but the Specific Plan fills only part of it right now.
The Draft EIR NOA is explicit: lands inside the SOI expansion area but outside the Specific Plan are not currently proposed for development and are not included in the Specific Plan adoption, pre-zoning, or annexation request.
At the same time, the 2025 City presentation states that roughly 520 acres would remain outside city limits under a Reserve designation but still inside the SOI.
So the map raises a practical civic question:
What does Riverbank gain (or risk) by expanding its sphere over land it is not yet annexing or developing?
Is it about long-term growth control? Preventing encroachment from other jurisdictions (a claim echoed in project advocacy materials)? Or is it an early step toward eventual buildout, with “Reserve” functioning less like protection and more like “not yet”?
This is not a rhetorical question. It’s a map question. And maps can be updated.
A moving target: how the numbers (and therefore the footprint) have shifted over time
One reason residents struggle to “hold the shape” of River Walk in their heads is that the project has evolved through the CEQA timeline.
The 2021 NOP-era materials present proposed land-use designations and acres for the broader project area and describe quantifiable objectives like up to 2,432 dwelling units, mixed-use acreage in multiple “MU” areas, and roughly 244.9 acres of park/greenway/open space.
Later City presentations and notices reflect updated breakdowns, a refined Specific Plan acreage, and revised mixed-use allocations.
Change is normal in planning. But it also creates a transparency problem: the public can’t easily compare “then vs. now” unless the project provides clear, versioned maps and tables that track what changed, where, and why.

What questions remain unanswered (the “blank spaces” on the public map)
A good map doesn’t only show what’s there. It shows what’s missing.
Here are the footprint-and-land-use questions that still need clearer public answers—ideally with parcel-based exhibits, GIS layers, and “this vs. that” comparisons that a resident can actually verify.
1) Where, exactly, is the public-access river trail—and where are the trailheads?
The project is repeatedly described as including a pedestrian/bicycle trail system and river connectivity. The land-use maps show a “Riverwalk Trail” line, but the practical details matter: access points, parking, hours, lighting, maintenance, and enforcement.
2) What does “preserve 48 acres” mean in management terms?
A proponent FAQ claims 48 acres of riverfront preservation and a mile of river frontage inside the levee. But preservation can mean many different regulatory and operational regimes. Is it protected by conservation easement? Owned by the City? Maintained by an HOA? Managed for habitat? The map needs that legend.
3) How much of the Specific Plan area will be graded vs. left in natural topography?
A land-use category can hide a lot of earthwork. Bluff areas, drainage corridors, ponds, and “dual use” basins can shift dramatically as engineering advances. The footprint conversation isn’t complete without grading limits and phasing maps.
4) How do irrigation canals and easements shape the final plan?
MID canals and easements cross the area. Where will crossings occur? Which easements restrict building? What buffers are required? These are not abstract concerns; they’re the literal lines that can reshape “what’s proposed.”
5) What happens to the “Reserve” lands inside the SOI expansion area?
The City’s NOA and presentations describe substantial land included in the SOI but not proposed for development now. What policies govern that reserve land? What would trigger future planning? What protections exist against incremental “scope creep”?
6) How does the plan reconcile farmland conversion concerns with the DEIR’s findings?
Opponents have repeatedly raised concerns about loss of agricultural land, and the Draft EIR identifies Agricultural Resources among categories with significant and unavoidable impacts. The footprint question here is straightforward: how much agricultural land is converted within the Specific Plan area, and what is the mitigation strategy?
7) Which portions are age-restricted—and how does that shape land-use intensity?
The project is described as heavily oriented toward an active adult community, and village summaries identify many villages as age-restricted. That matters for footprint because it affects density assumptions, trip generation, and the character of “mixed-use” areas intended to serve residents.most leverage—because the record is still being written.
Why this matters: the footprint is the argument
A project like River Walk gets debated in the familiar vocabulary—housing, traffic, taxes, sprawl, parks. But all of those arguments eventually collapse into one tangible, verifiable thing: the map.
And not just the pretty map. The hard map:

- annexation boundaries,
- pre-zoning areas,
- parcel ownership and control,
- easements and setbacks,
- flood and levee interfaces,
- and the exact geometry of what becomes urbanized first.
Public documents already confirm the project’s basic scale (SOI expansion around 1,522 acres; Specific Plan around 997 acres; thousands of housing units; hundreds of thousands of square feet of mixed-use). What remains, for residents trying to understand the true footprint, is the translation from categories to consequences—and from lines on a slide to lines in the ground.
In the next installment, we’ll follow one of the most consequential footprint questions downstream: what the project’s relationship to the Stanislaus River corridor implies for habitat, hydrology, and the kind of “open space” River Walk actually becomes.